
This is my last blog post in 2021. I wish you all a wonderful break and a happy new year.
In the first post of my Power BI 101 series, we learnt that Power BI is a data platform containing various tools and services. We also explained the currently available subscriptions within the Power BI platform. The focus of the second post of this series is on what we should learn to achieve our goals more efficiently. In this post, we focus on the reporting tools available to us according to our subscription plan. From this post onwards, we discuss more specific aspects of the Power BI platform.
We learnt so far that Power BI is not just a reporting tool to build sophisticated reports; it is indeed a platform supplying a wide range of features from data preparation, data modelling and data visualization to contribute to an organisation’s data analysis journey in many ways such as sharing datasets, reports, and dashboards. All of these are possible only if we take the correct steps in building our Power BI ecosystem. But, it is very true that Power BI gives us the flexibility to create professional-looking and eye-catching visualisations providing easy to understand insights around a subject. The most renowned tool within Power BI is Power BI Desktop, but it is not the only tool available to us to create reports. Besides, Power BI Desktop reports are not necessarily the best answer to all business requirements. In fact, the business requirements define the Power BI architecture that supports those requirements. Based on the architecture, organisations decide to acquire a certain subscription plan, and based on the subscription plan, we have various reporting tools available to us. At this point, you might ask, “well, what architecture supports my organisation requires?”. Let’s answer that question in a future blog post.
For the purpose of this blog post, it is enough to know what reporting tools are available under which subscription plans. Let’s get started.
Reporting tools available in Power BI #
As mentioned earlier, there are various reporting tools available to us. Let’s first see what reporting tools are available to us regardless of the subscription plans. Then we will look at the subscription plans supporting those tools.
Power BI Service #
Power BI Service is a SaaS (Software as a Service) offering from Microsoft in the cloud. The users within an organisation, depending on their access rights, may create reports directly in Power BI Service. The users can also securely share and distribute those reports. While creating or editing reports is possible in Power BI Service, it is strongly recommended to avoid this method for several reasons. The most obvious one is that the changes we make to a report may soon get overwritten by someone else that republishes the same report from Power BI Desktop. Check this blog post from SQLChick to see why you should avoid creating or editing reports directly from Power BI Service. The reports are downloadable in PBIX format.
You can access Power BI Service here.
Power BI Desktop #
It is a desktop application built for data preparation, data modelling and data visualisation. If you like to learn about data modelling with Power BI, check out my book here. We can use Power BI Desktop to connect to more than 250 different data sources, preparing, transforming and cleansing that data and at lastly visualising the data. Power BI Desktop is the predominant and most renowned report authoring tool available in the Power BI platform. It has many more functionalities and is more flexible than Power BI Service. For instance, setting up Role Level Security (RLS) is not available in Power BI Service. The file format of the reports created in Power BI Desktop is PBIX.
Download Power BI Desktop from here.
Power BI Report Builder (Paginated) #
Paginated reports aka pixel-perfect reports are formatted in a way to fit perfectly on a page. That report page might later be printed. We have exact control over page formatting to display our data in tables or charts. The reports are not as interactive as the reports created in Power BI Desktop.
Paginated reports are based on RDL technology which is standard report format in SQL Server Reporting Services (SSRS). The tool for developing a paginated report in the Power BI ecosystem is Power BI Report Builder. The reports file type is RDL. We can currently publish Paginated reports only to a Workspace that is backed with either a Premium Per User (PPU) or a Premium Capacity.
Download Power BI Report Builder from here.
Power BI Desktop Optimised for Report Server (RS) #
Power BI Report Server (PBIRS) is an on-premises server capable of rendering Power BI report files (PBIX). If we have a PBIRS up and running within our organisation and we require to publish Power BI reports to PBIRS, then we will need to create our reports in a special edition of Power BI Desktop which is optimised for PBIRS. This edition is different from Power BI Desktop, which we usually use to create and publish our reports to Power BI Service. For instance, Power BI Desktop RS does not include the preview features we used to see in Power BI Desktop until those features are released. Building reports in Power BI Desktop RS guarantees that the reports are fully functional after being deployed to our PBIRS. We can install Power BI Desktop and Power BI Desktop RS side-by-side on the same machine.
Download Power BI Desktop RS from here.
Microsoft Excel #
Microsoft Excel is an amazing spreadsheet software with many analytical capabilities. Without a doubt, Excel is one the most widely used software every accountant has in their toolbox. It is robust, flexible and very powerful in data visualisation and data analysis. With Microsoft Excel, we can connect to many different data sources (just like Power BI Desktop). We can use Power Query for Excel to load data into workbooks, transform and combine that data and load it into a data model available in Power Pivot. We can also build a data model in Power Pivot. Microsoft Excel provides a robust reporting experience. We can publish the Excel files to Power BI Service in two ways:
- Publishing Excel as an Excel workbook
- Publishing Excel data model as a dataset
If we select to publish the Excel reports as a workbook, then we will get a full Excel experience within Power BI Service just line how the Excel Online works. In contrast, if we publish the data model from Excel as a dataset then the datasets created in Excel, just like any other datasets in Power BI Service, are available to authorised people.
The Excel datasets, like other published datasets in Power BI Service, can also be used to create reports in Power BI Service or Power BI Desktop.
Report Builder #
Report Builder is also known as SQL Server Report Builder. It is a stand-alone report authoring tool installed on our PC. We can create paginated reports in the Report Builder and deploy the reports to a Power BI Report Server instance. Report Builder is very similar to Power BI Report Builder. The difference between the two is that with Report Builder you can deploy the reports to an on-premises Power BI Report Server but with Power BI Report Builder you can currently publish the reports to a Premium Workspace in Power BI Service.
Download Report Builder from here.
Mobile Report Publisher (aka DataZen) #
Microsoft SQL Server Mobile Report Publisher is a report authoring tool for SQL Server 2016 Reporting Services (SSRS) and above. Mobile Report Publisher’s original name is DataZen which was initially released in 2013 and acquired by Microsoft in 2014. Microsoft integrated DataZen into SQL Server Reporting Services 2016. You may ask “how Mobile Report Publisher is related to Power BI?“. The answer is that we can create Reporting Services mobile reports using the Mobile Report Publisher and deploy those reports into a Power BI Report Server. The reports built with Mobile Report Publisher are optimized for consumption in mobile devices.
Download Mobile Report Publisher from here.
Now that we know all our reporting options in the Power BI ecosystem, let’s find out how these reporting tools are supported on different subscription plans.
Power BI Subscriptions and their Supported Reporting Tools #
One of the most important decisions every organisation should make is to come up with an architecture that supports the organisation’s analytical requirements. Depending on the architecture, you may require one of the following subscription plans or a combination of them.
Here is a very brief explanation of currently available subscriptions and their available reporting tools.
Power BI Free #
As the name resembles, this is the free offering from Microsoft. We do not require to subscribe or pay anything to create our reports in Power BI Desktop and publish them to the Power BI Service.
Available reporting tools:
- Power BI Desktop
- Power BI Service (creating report capability)
Power BI Pro #
Power BI Pro is the first subscription tier offering from Microsoft. The following reporting tools are available under the Power BI Pro:
- Power BI Desktop
- Power BI Service (creating report capability)
- Microsoft Excel
- Analyse in Excel
- Connecting to Power BI Datasets and creating reports in Excel
You may wonder how the Analyse in Excel and Connecting to Power BI Datasets are different. Here is the answer, depending on our permissions, we have the preceding two options to connect to and create reports in Excel on top of existing Power BI reports and datasets on the Power BI Service.
Analyse in Excel
This option is accessible from the Power BI Service on top of the existing reports or datasets on the Power BI Service itself. After we login to the service, if we have permission, we can…
- Click on the More Options button on a report or a dataset
- Click Analyse in Excel
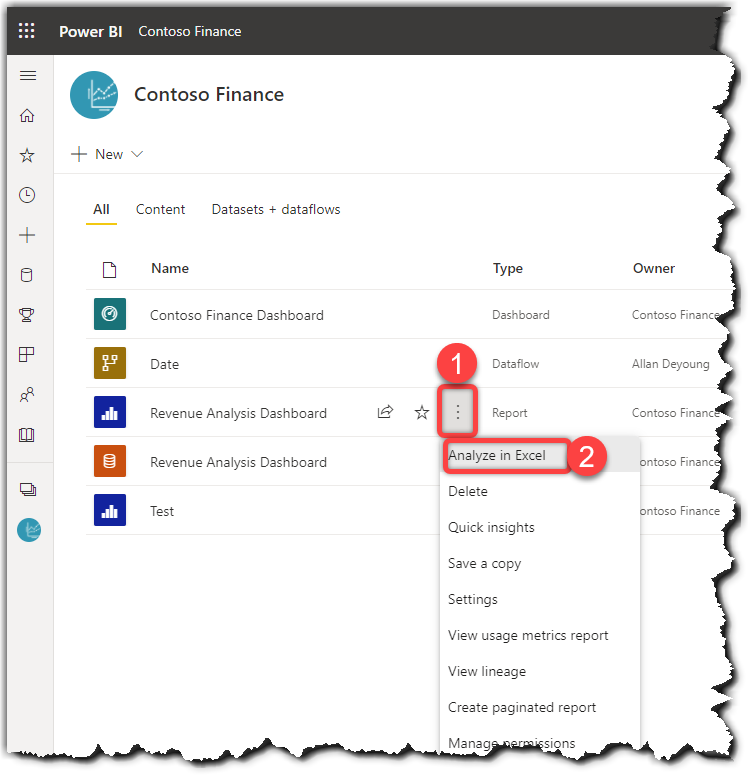
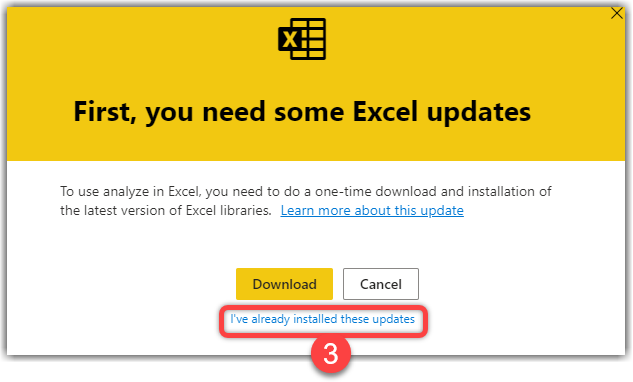
- If you already have the latest version of Excel libraries installed on your machine then click Download otherwise click the I’ve already installed these updates hyperlink. A I have the Excel libraries installed on my machine, I click the hyperlink
The above process downloads an Excel file connected to the underlying dataset. You can open the Excel file and start creating your reports.
Connecting to Power BI Datasets and creating reports in Excel
In this scenario, we connect from Excel to the datasets available to us on the Power BI Service. The following steps explain how to do so:
- Open Excel and login to your M365 account
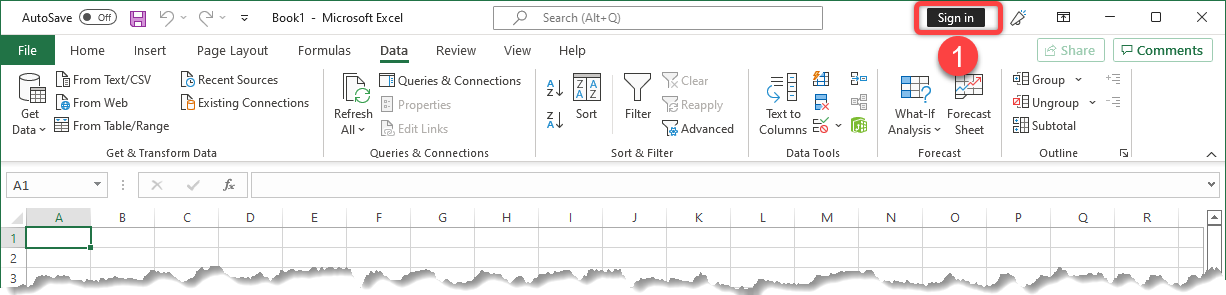
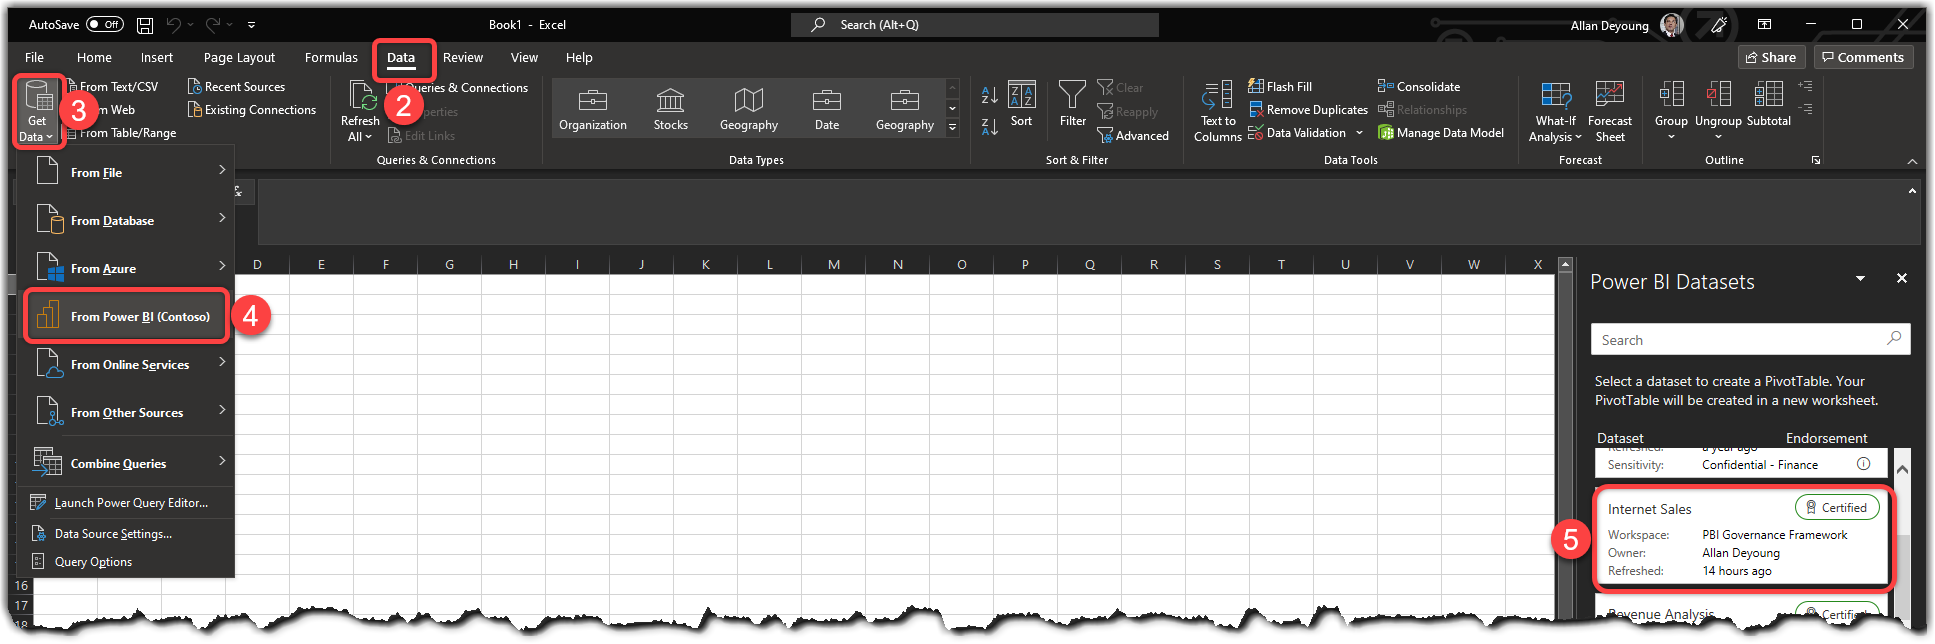
- Click the Data tab
- Click the Get Data button
- Click From Power BI Dataset
- You require to pass your Power BI credentials, then you can select the desired dataset to connect to
Note
We require to M365 account to be able to use connect to a Power BI dataset.
Power BI Premium Per User (PPU) #
The PPU subscription allows organisations to get the premium features by subscribing to a PPU for each user. Read more about PPU and its features here. The following reporting tools are available to us when we have a PPU subscription:
- Power BI Desktop
- Power BI Service (creating reports capability)
- Microsoft Excel
- Analyse in Excel
- Connecting to Power BI datasets and reports from Excel
- Power BI Report Builder (Paginated reports)
- Thirdpatry reporting tools such as Tableau via XMLA endpoints
Power BI Premium Capacity #
Power BI Premium is an enterprise-grade BI offering in the Power BI ecosystem. This is a capacity-based subscription that means we get dedicated resources and offers greater scale and performance for Power BI. The Power BI Premium capacity enables more users across the organisation to get the most out of all available Power BI contents with better performance. Read more about Power BI Premium capacity here. The following reporting tools are available to us when we have a Premium capacity:
- Power BI Desktop
- Power BI Service (creating reports capability)
- Microsoft Excel
- Analyse in Excel
- Connecting to Power BI datasets and reports from Excel
- Power BI Report Builder (Paginated reports)
- Thirdpatry reporting tools such as Tableau via XMLA endpoints
- Power BI Desktop Optimised for Report Server (RS)
- Report Builder
- Mobile Report Publisher (aka DataZen)
Power BI Embedded #
Power BI Embedded is another service offering from Microsoft mainly for software development companies who want to embed Power BI reporting functionality into their applications. You may use Power BI Embedded in your organisation either you’re a software vendor (ISV) or you’re building in house applications that include Power BI reporting functionality or you’d like to test some Power BI Premium Capacity functionalities. Yes! That’s right. Power BI Embedded capacity works very similar to Power BI Premium capacity and a lot of Premium functionalities are available in Embedded capacity as well like the ability to use XMLA endpoints over both Embedded and Premium capacities. You can test an Embedded capacity for free. Read this post to find out how. Learn more about Power BI Embedded here. The following reporting tools are available to us when we have an Embedded capacity:
- Power BI Desktop
- Power BI Service (creating reports capability)
- Microsoft Excel
- Analyse in Excel
- Connecting to Power BI datasets and reports from Excel
- Power BI Report Builder (Paginated reports)
- Thirdpatry reporting tools such as Tableau via XMLA endpoints
- Power BI Desktop Optimised for Report Server (RS) (Only available in A4 SKU and above)
Here you go. Now you have a better understanding of the reporting tools available on the Power BI ecosystem and when you can use them. If you have any comments, please share it with us in the comments section below.
Discover more from BI Insight
Subscribe to get the latest posts sent to your email.