In my consulting experience working with customers using Power BI, many challenges that Power BI developers face are due to negligence to data types. Here are some common challenges that are the direct or indirect results of inappropriate data types and data type conversion:
- Getting incorrect results while all calculations in your data model are correct.
- Poor performing data model.
- Bloated model size.
- Difficulties in configuring user-defined aggregations (agg awareness).
- Difficulties in setting up incremental data refresh.
- Getting blank visuals after the first data refresh in Power BI service.
In this blogpost, I explain the common pitfalls to prevent future challenges that can be time-consuming to identify and fix.
Background #
Before we dive into the topic of this blog post, I would like to start with a bit of background. We all know that Power BI is not only a reporting tool. It is indeed a data platform supporting various aspects of business intelligence, data engineering, and data science. There are two languages we must learn to be able to work with Power BI: Power Query (M) and DAX. The purpose of the two languages is quite different. We use Power Query for data transformation and data preparation, while DAX is used for data analysis in the Tabular data model. Here is the point, the two languages in Power BI have different data types.
The most common Power BI development scenarios start with connecting to the data source(s). Power BI supports hundreds of data sources. Most data source connections happen in Power Query (the data preparation layer in a Power BI solution) unless we connect live to a semantic layer such as an SSAS instance or a Power BI dataset. Many supported data sources have their own data types, and some don’t. For instance, SQL Server has its own data types, but CSV doesn’t. When the data source has data types, the mashup engine tries to identify data types to the closest data type available in Power Query. Even though the source system has data types, the data types might not be compatible with Power Query data types. For the data sources that do not support data types, the matchup engine tries to detect the data types based on the sample data loaded into the data preview pane in the Power Query Editor window. But, there is no guarantee that the detected data types are correct. So, it is best practice to validate the detected data types anyway.
Power BI uses the Tabular model data types when it loads the data into the data model. The data types in the data model may or may not be compatible with the data types defined in Power Query. For instance, Power Query has a Binary data type, but the Tabular model does not.
The following table shows Power Query’s datatypes, their representations in the Power Query Editor’s UI, their mapping data types in the data model (DAX), and the internal data types in the xVelocity (Tabular model) engine:
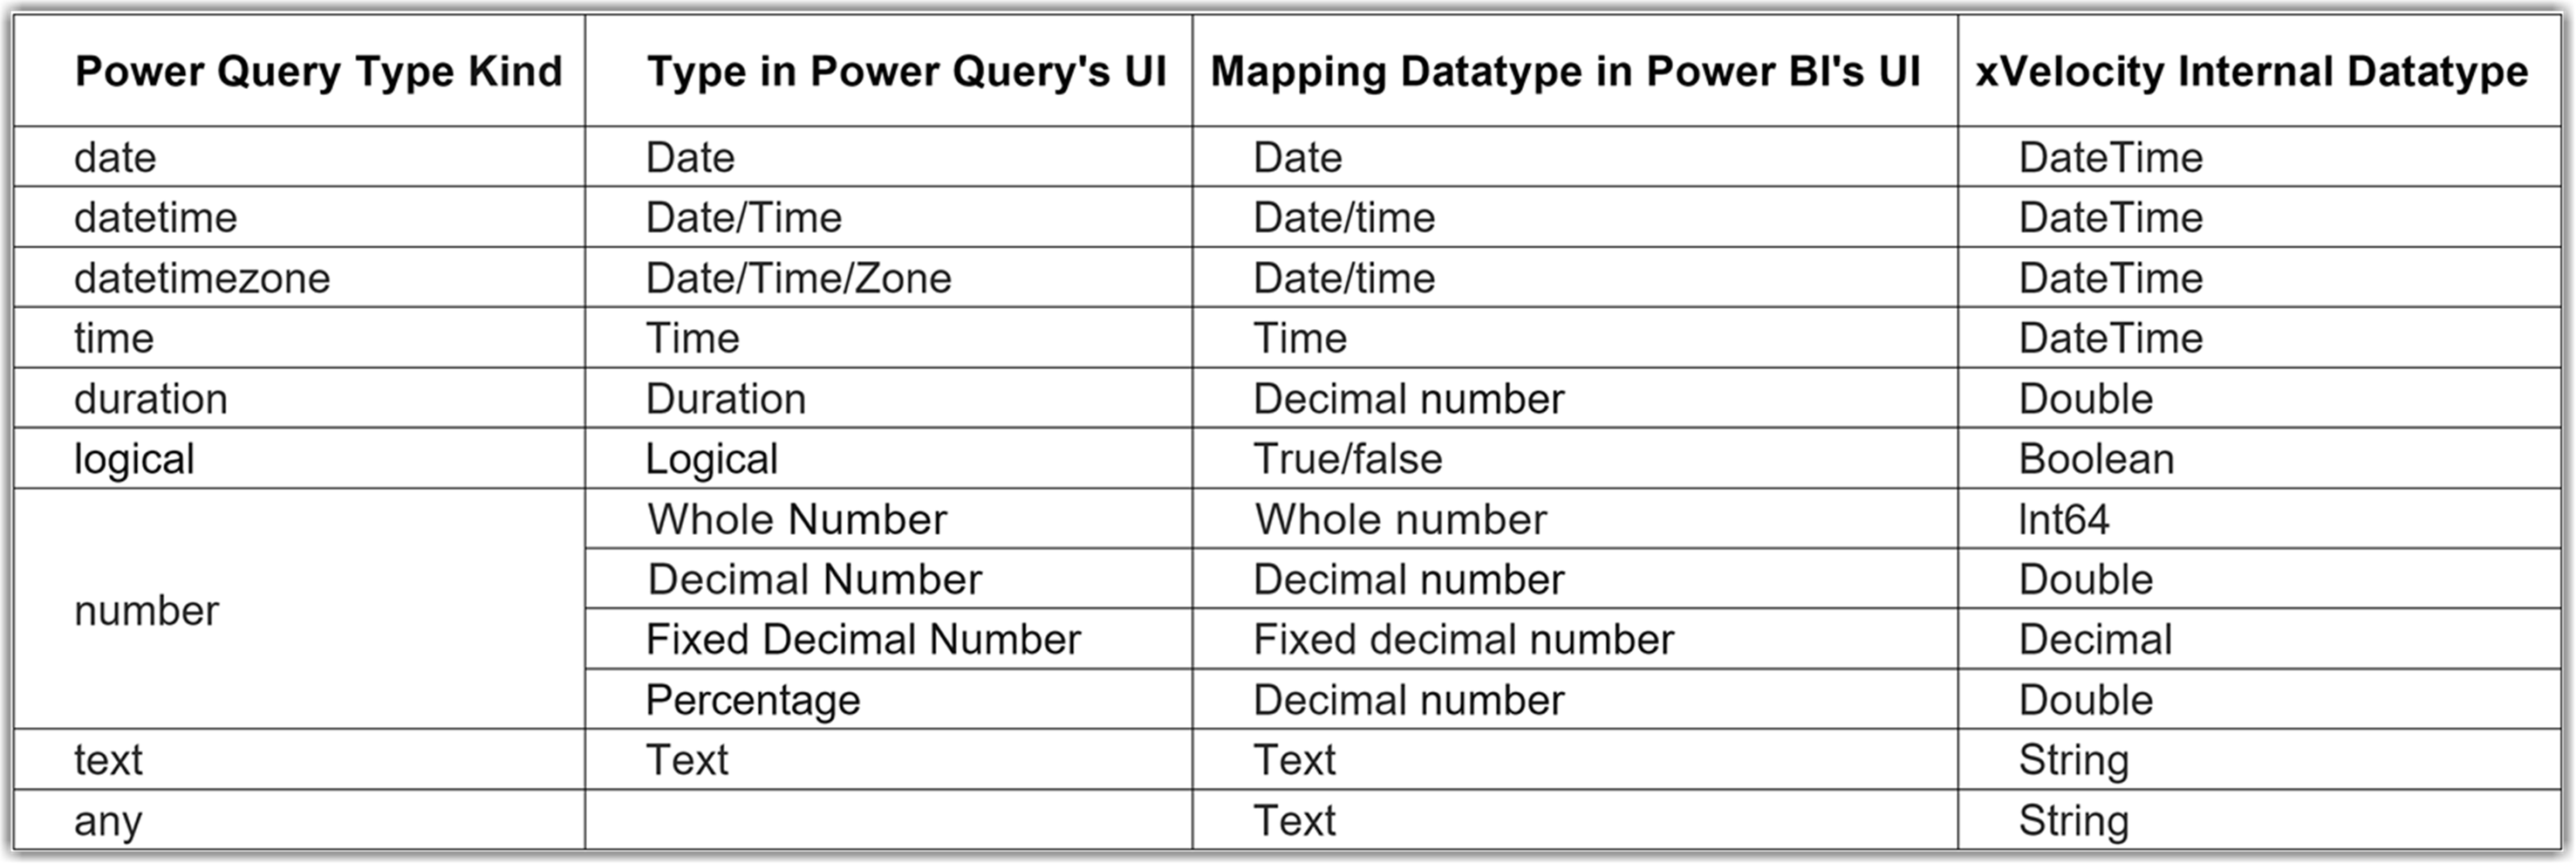
As the above table shows, in Power Query’s UI, Whole Number, Decimal, Fixed Decimal and Percentage are all in type number in the Power Query engine. The type names in the Power BI UI also differ from their equivalents in the xVelocity engine. Let us dig deeper.
Data Types in Power Query #
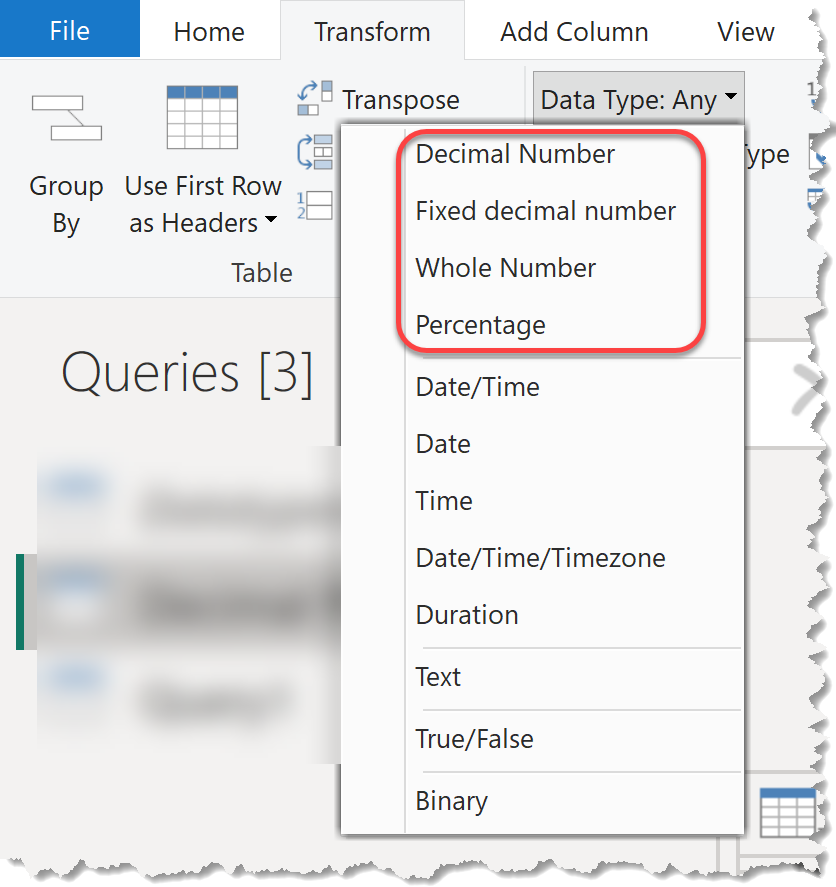
As mentioned earlier, in Power Query, we have only one numeric datatype: number while in the Power Query Editor’s UI, in the Transform tab, there is a Data Type drop-down button showing four numeric datatypes, as the following image shows:
In Power Query formula language, we specify a numeric data type as type number or Number.Type. Let us look at an example to see what this means.
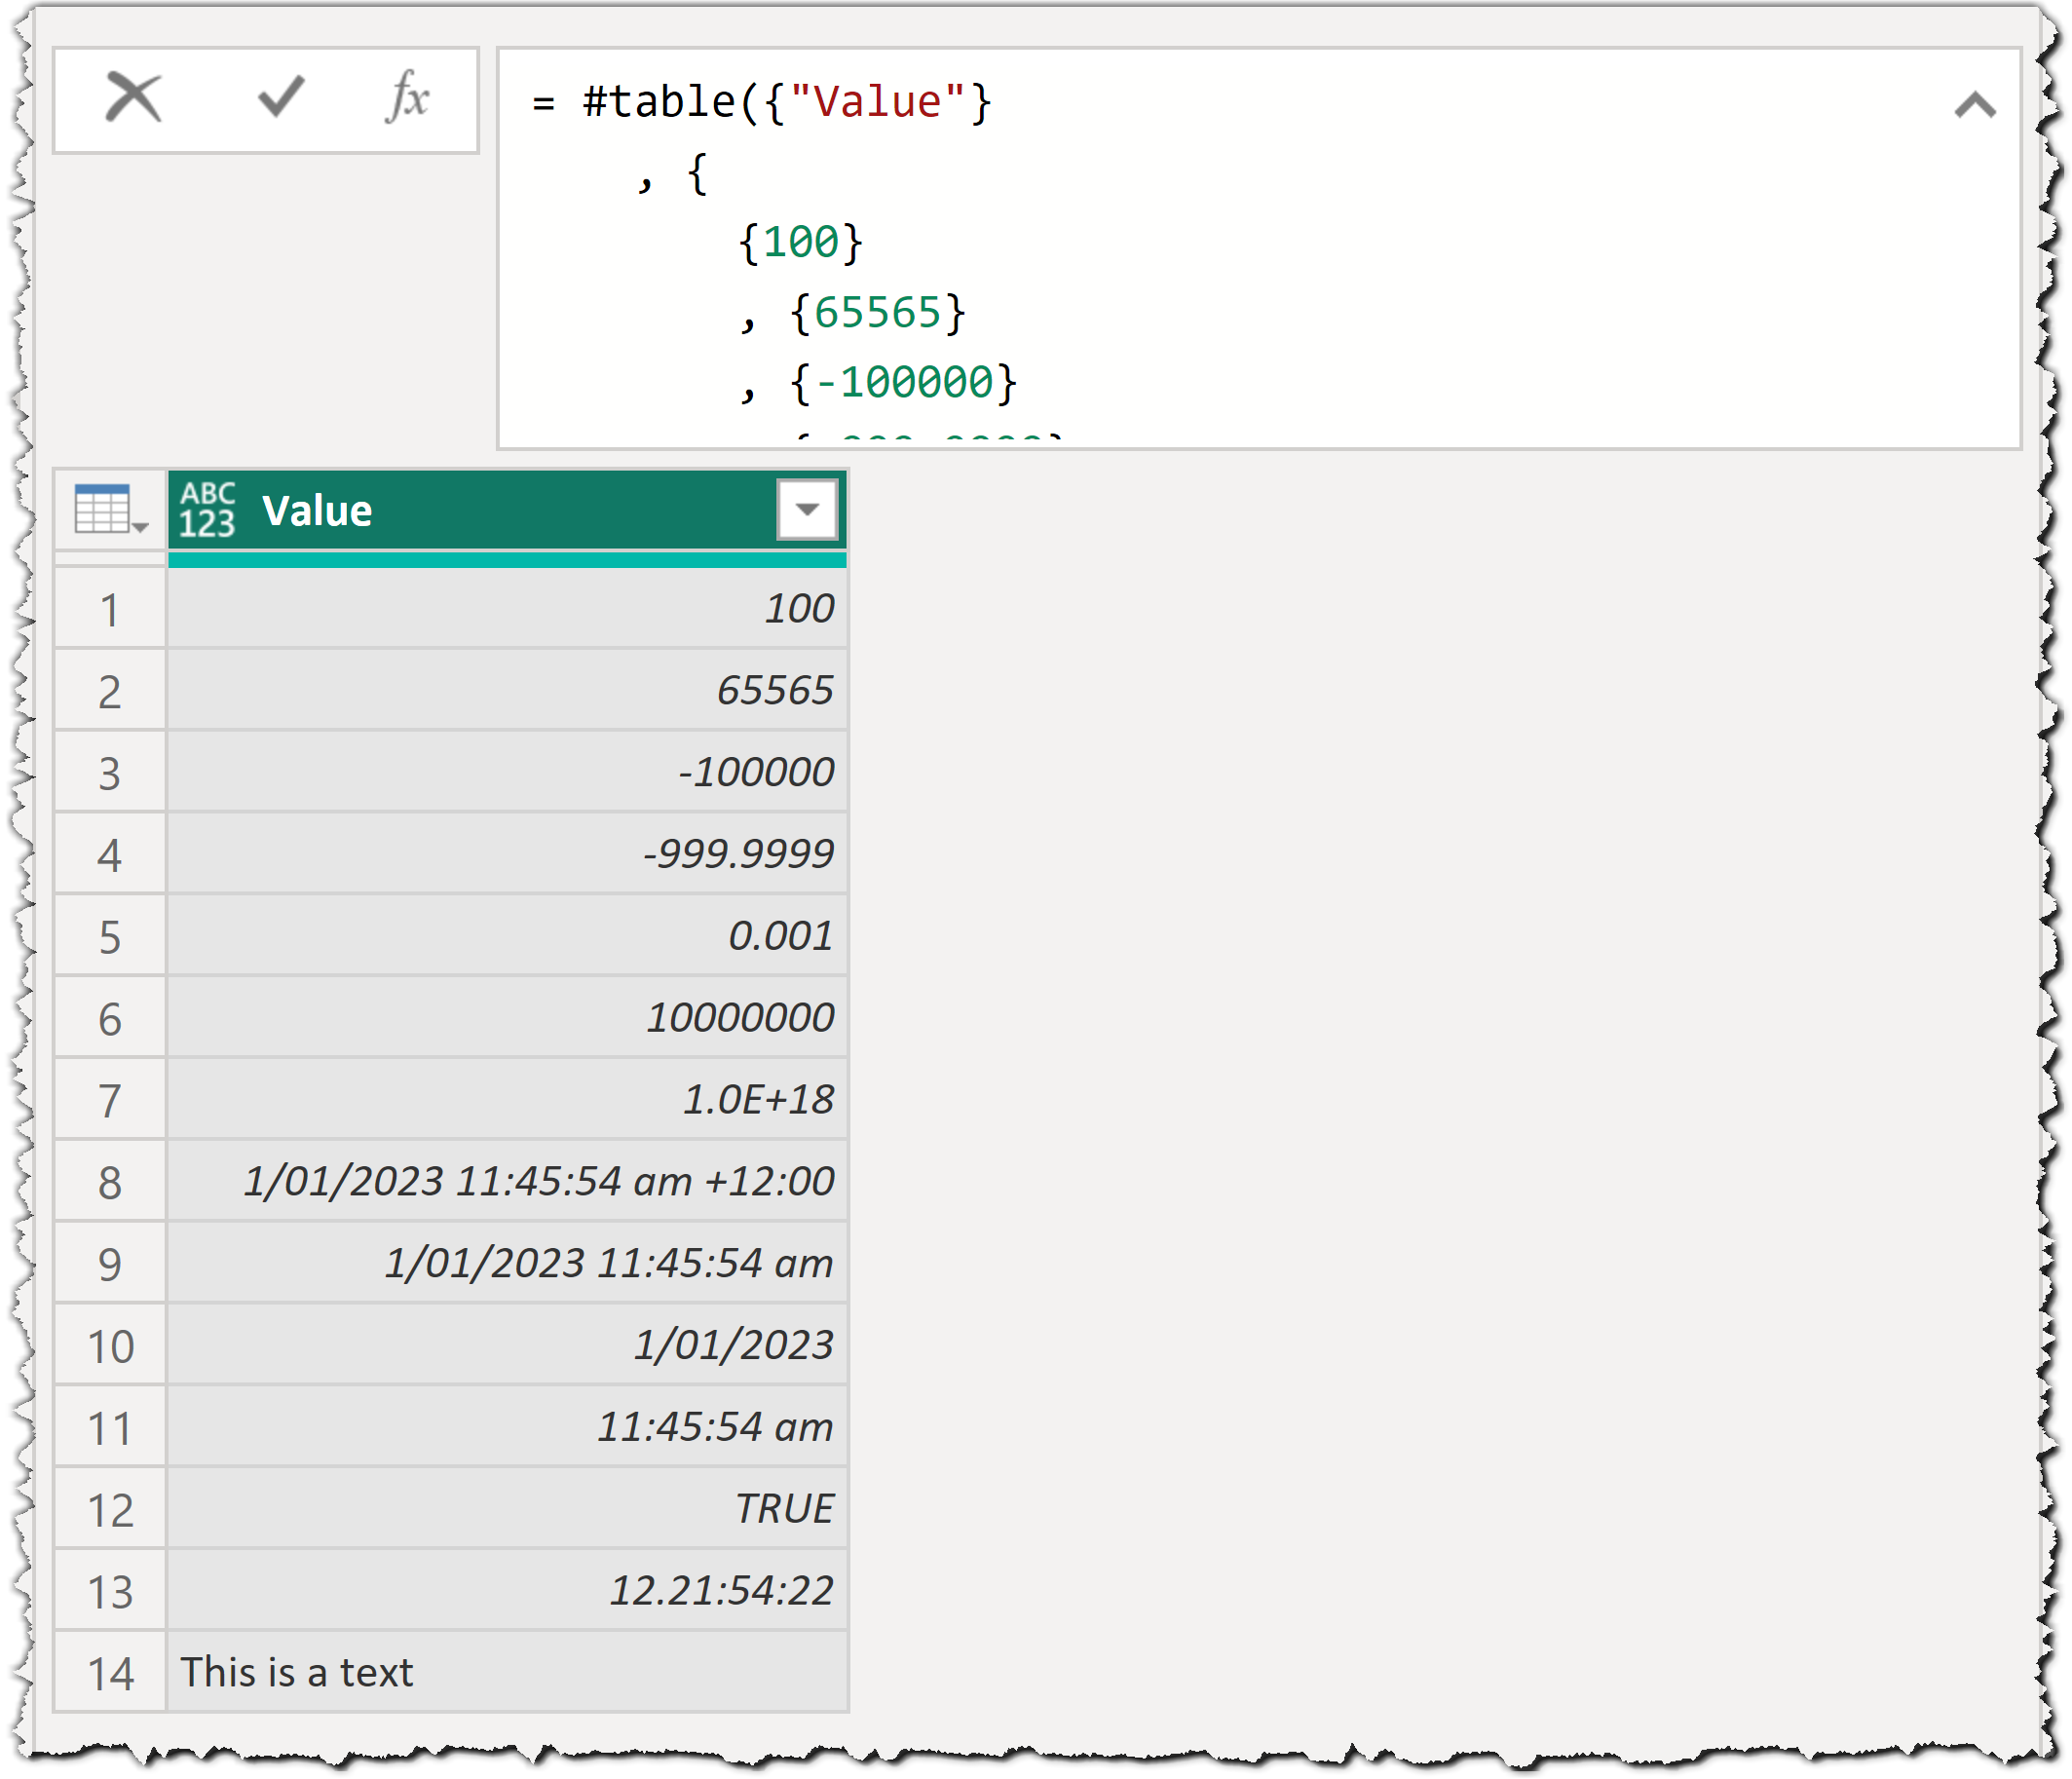
The following expression creates a table with different values:
#table({"Value"}
	, {
		{100}
		, {65565}
		, {-100000}
		, {-999.9999}
		, {0.001}
		, {10000000.0000001}
		, {999999999999999999.999999999999999999}
		, {#datetimezone(2023,1,1,11,45,54,+12,0)}
		, {#datetime(2023,1,1,11,45,54)}
		, {#date(2023,1,1)}
		, {#time(11,45,54)}
		, {true}
		, {#duration(11,45,54,22)}
		, {"This is a text"}
	})
The results are shown in the following image:
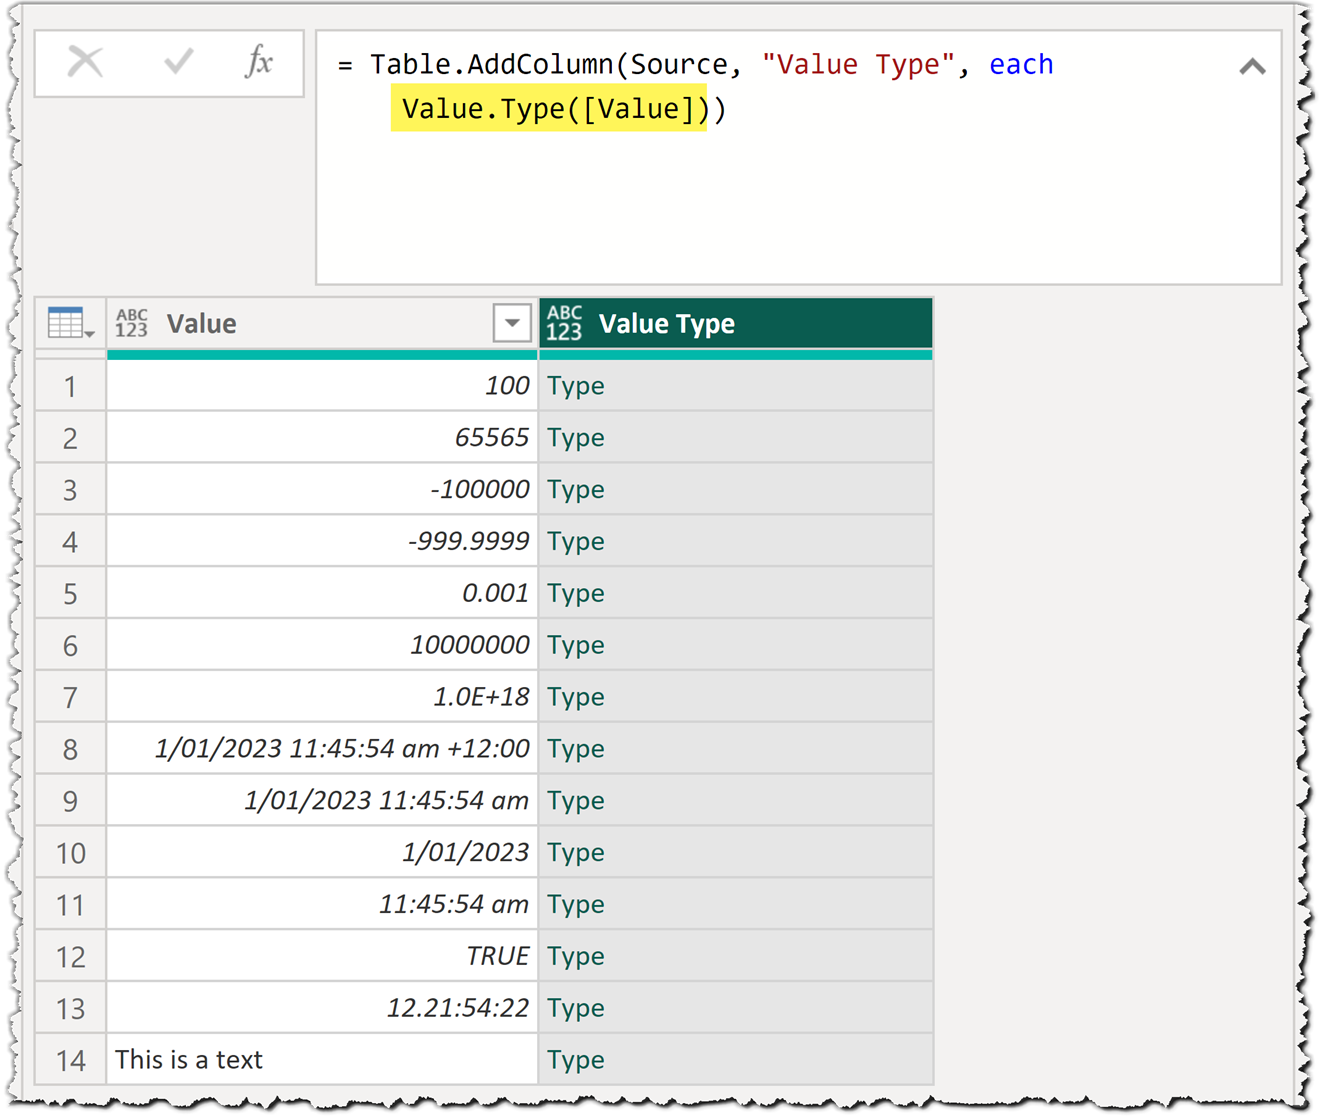
Now we add a new column that shows the data type of the values. To do so, use the Value.Type([Value]) function returns the type of each value of the Value column. The results are shown in the following image:
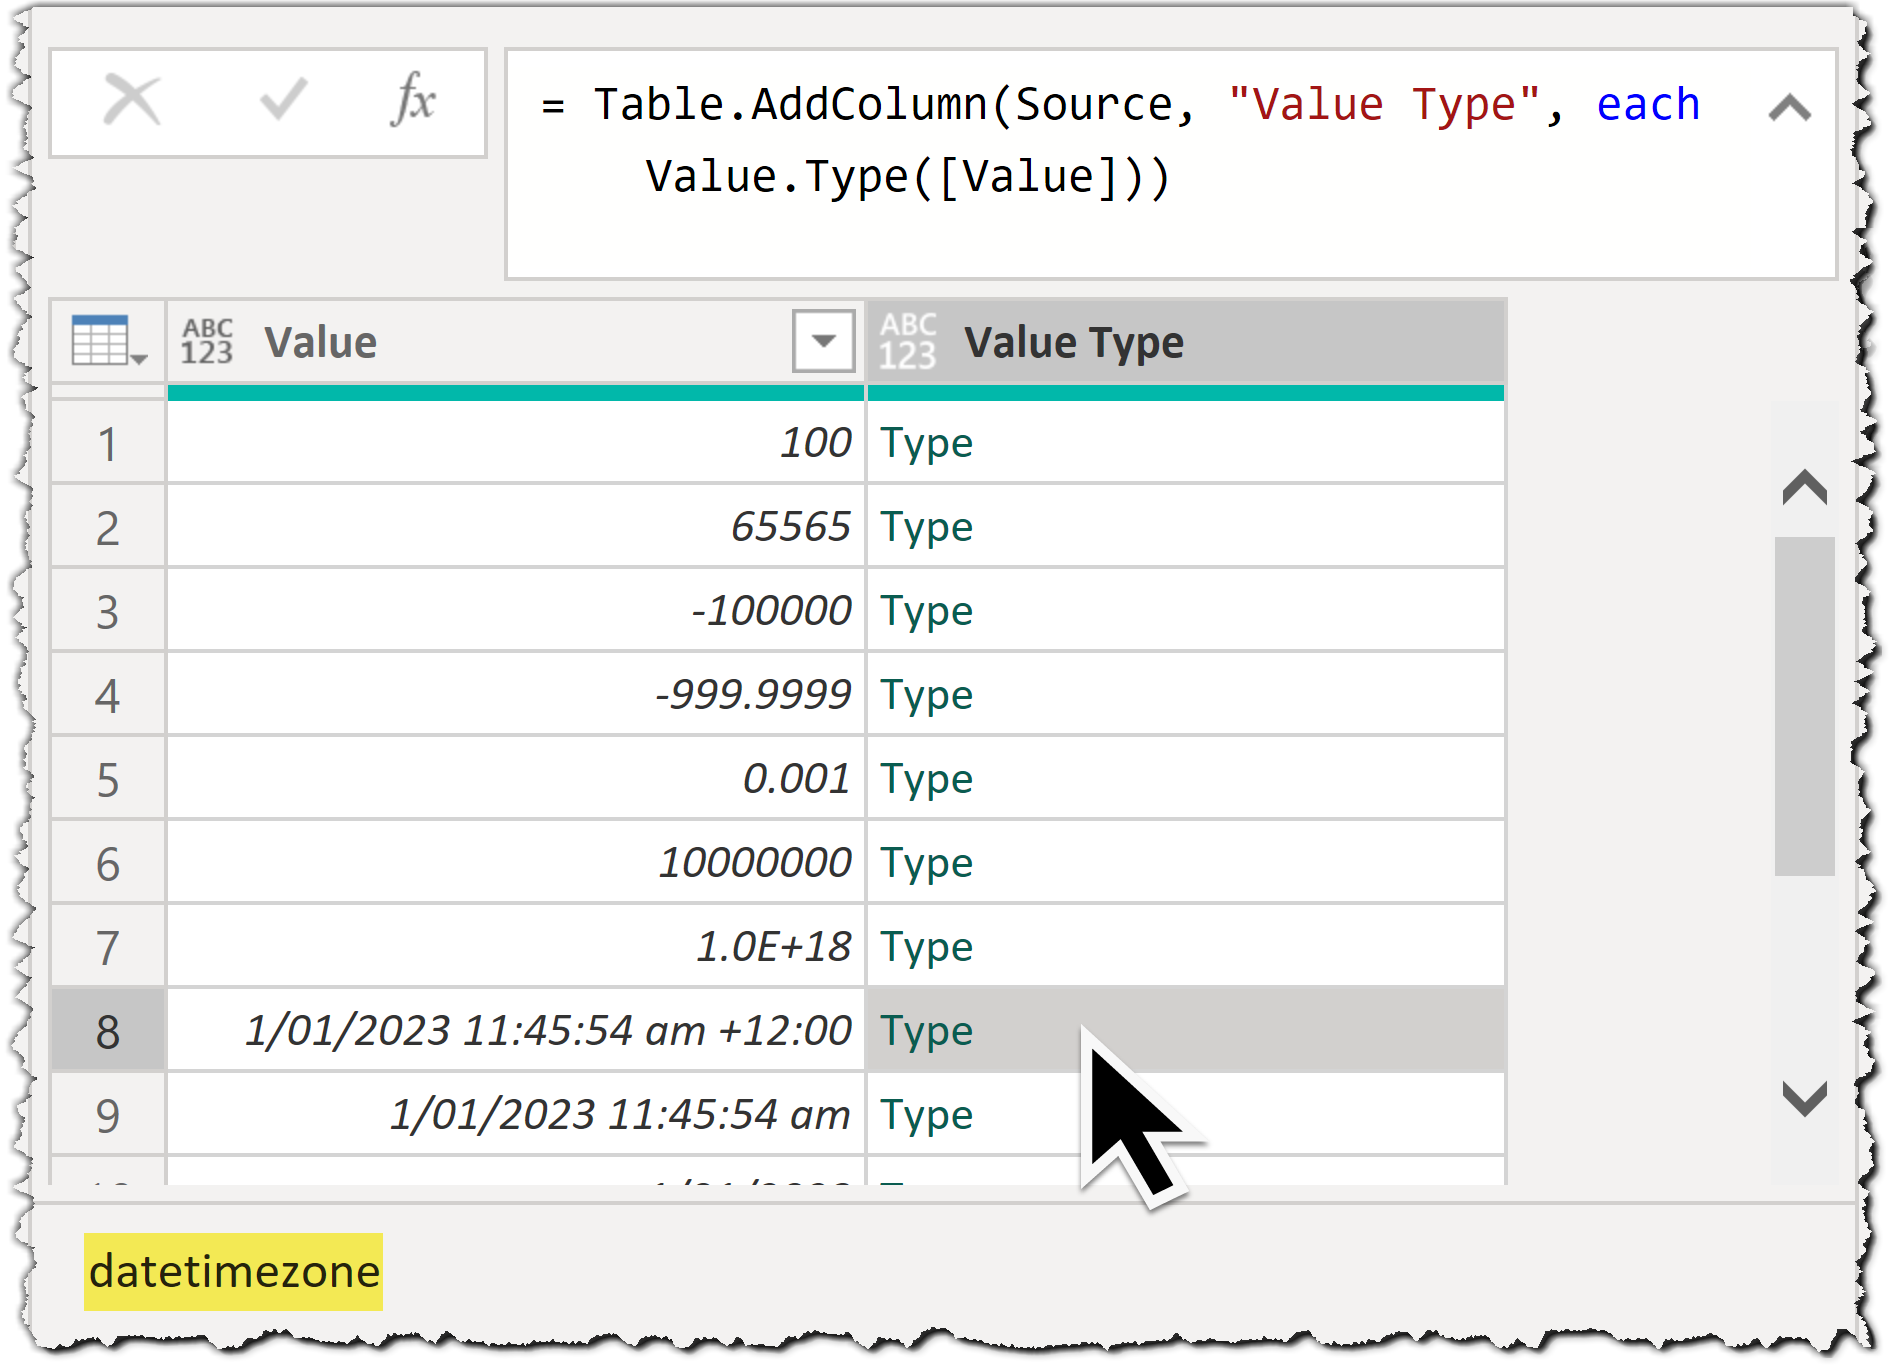
To see the actual type, we have to click on each cell (not the values) of the Value Type column, as shown in the following image:
With this method, we have to click each cell in to see the data types of the values that is not ideal. But there is currently no function available in Power Query to convert a Type value to Text. So, to show each type’s value as text in a table, we use a simple trick. There is a function in Power Query returning the table’s metadata: Table.Schema(table as table). The function results in a table revealing useful information about the table used in the function, including column Name, TypeName, Kind, and so on. We want to show TypeName of the Value Type column. So, we only need to turn each value into a table using the Table.FromValue(value as any) function. We then get the values of the Kind column from the output of the Table.Schema() function.
To do so, we add a new column to get textual values from the Kind column. We named the new column Datatypes. The following expression caters to that:
Table.Schema(
      Table.FromValue([Value])
      )[Kind]{0}
The following image shows the results:
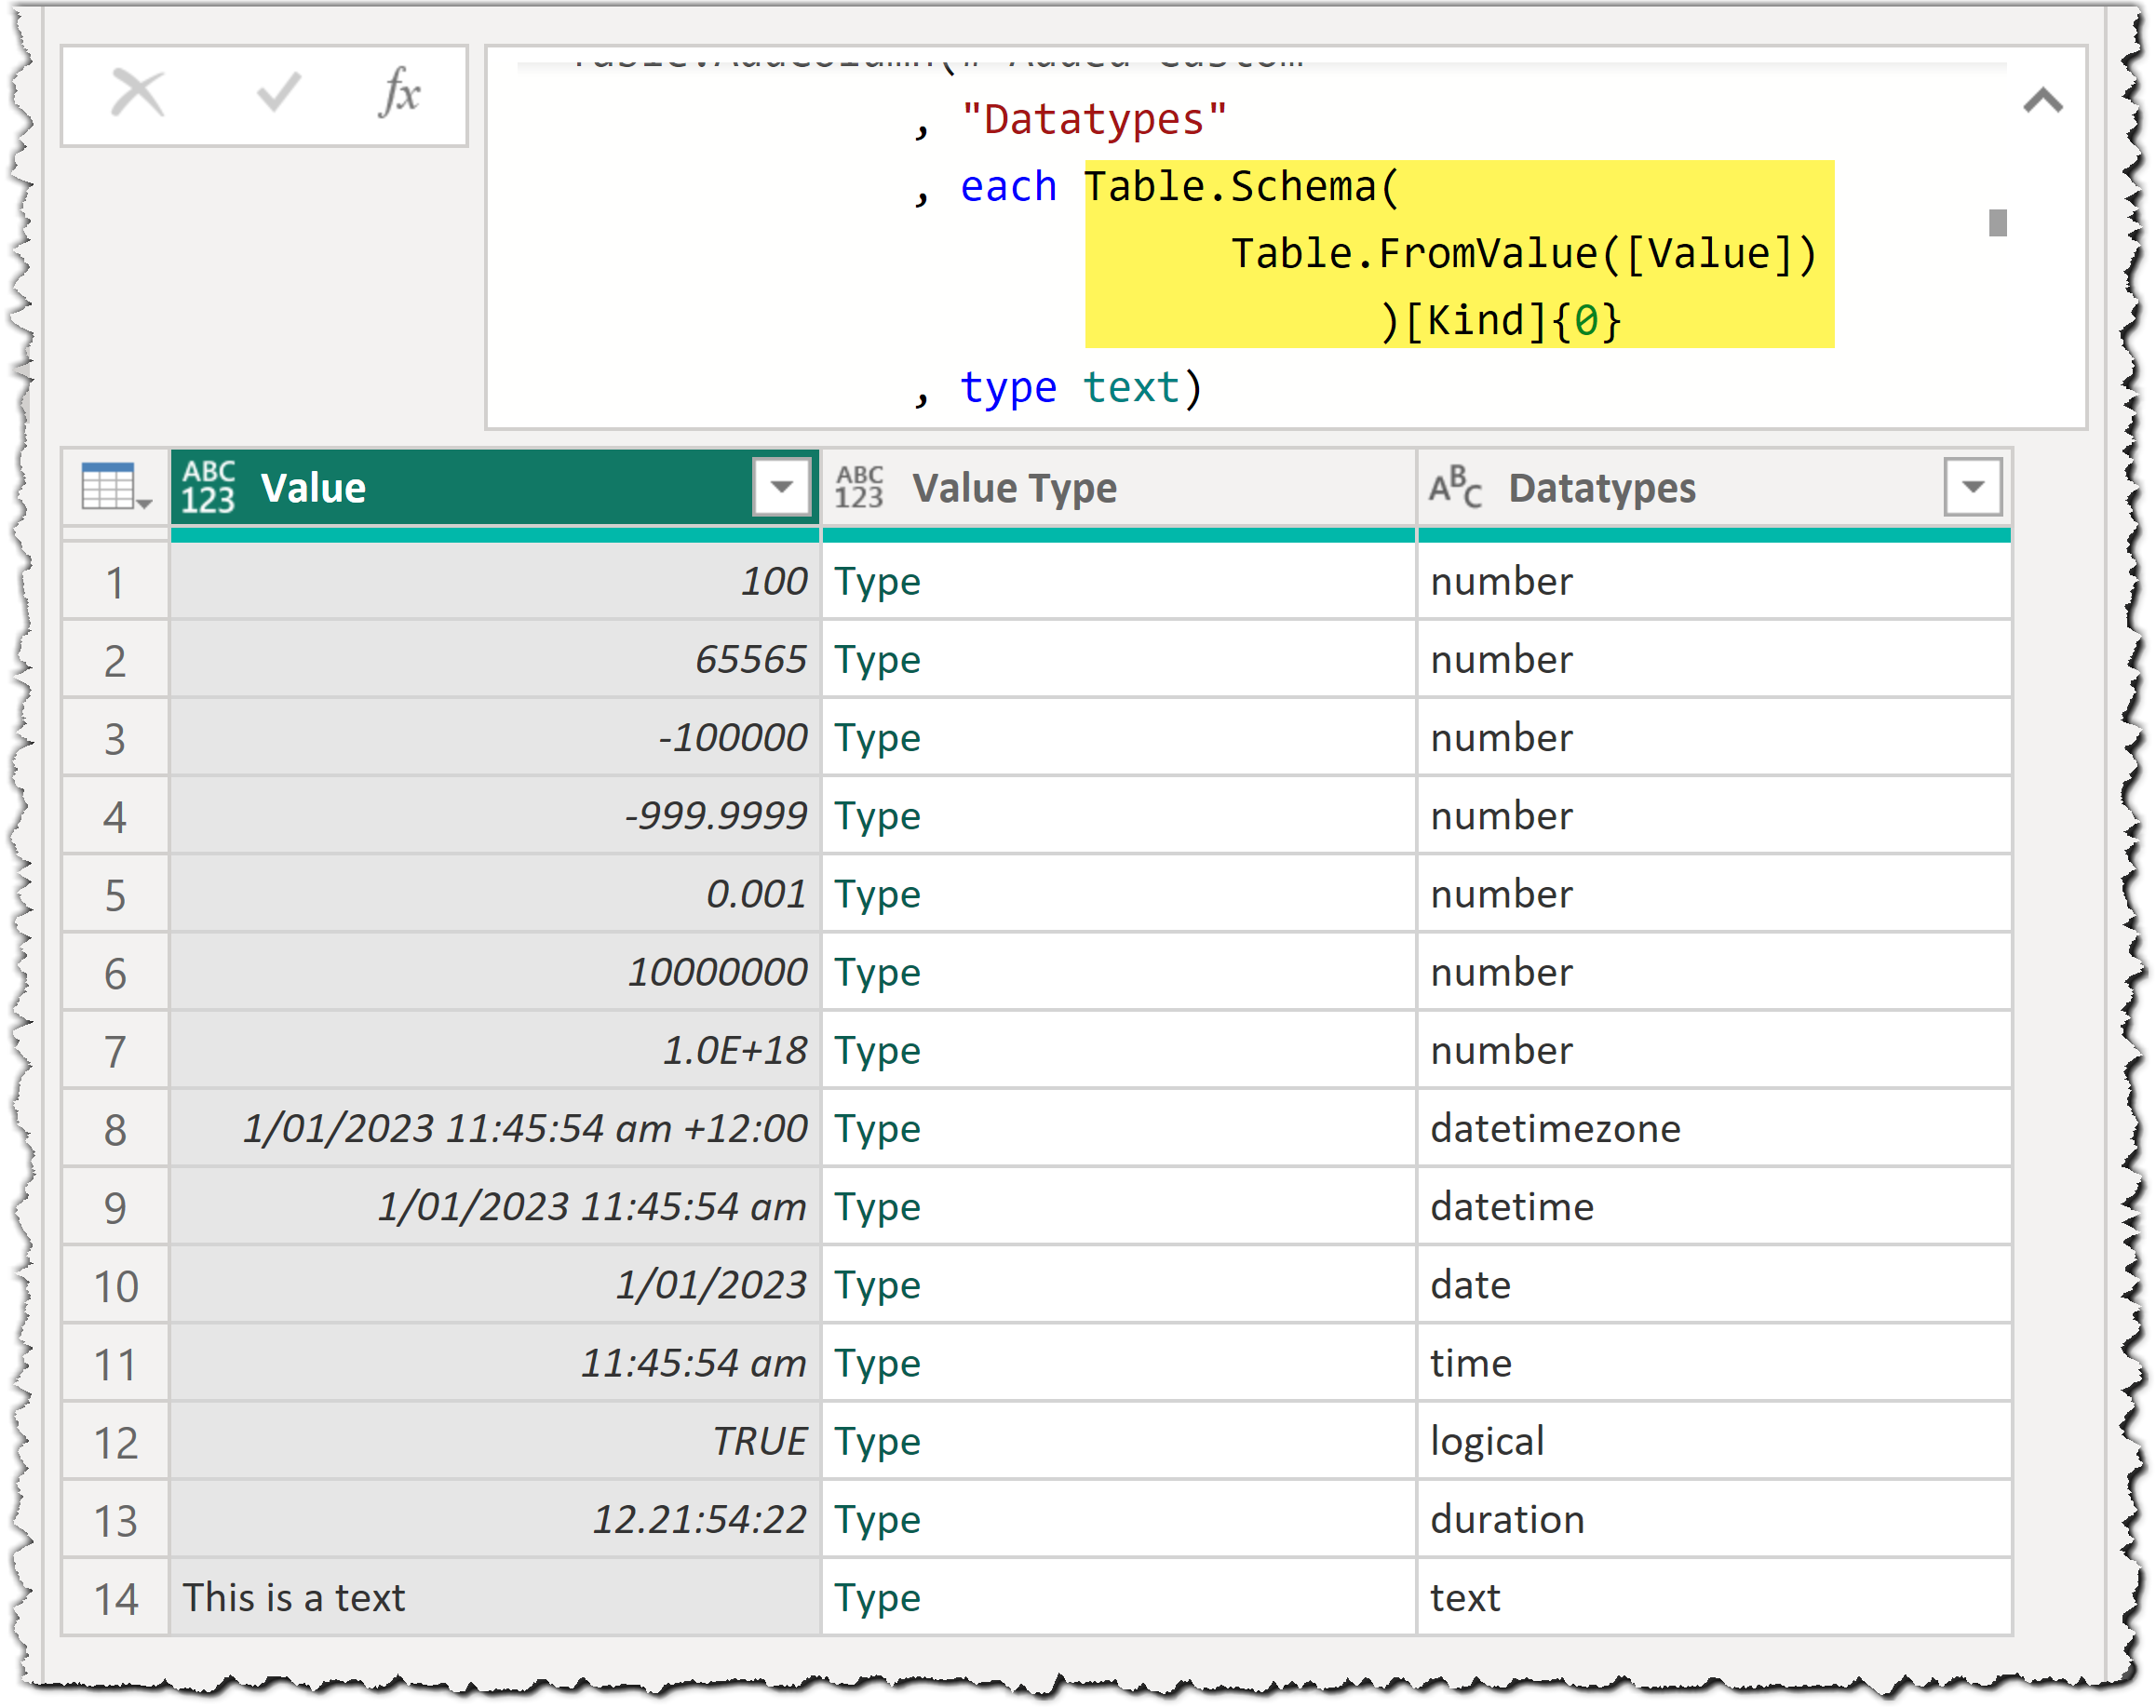
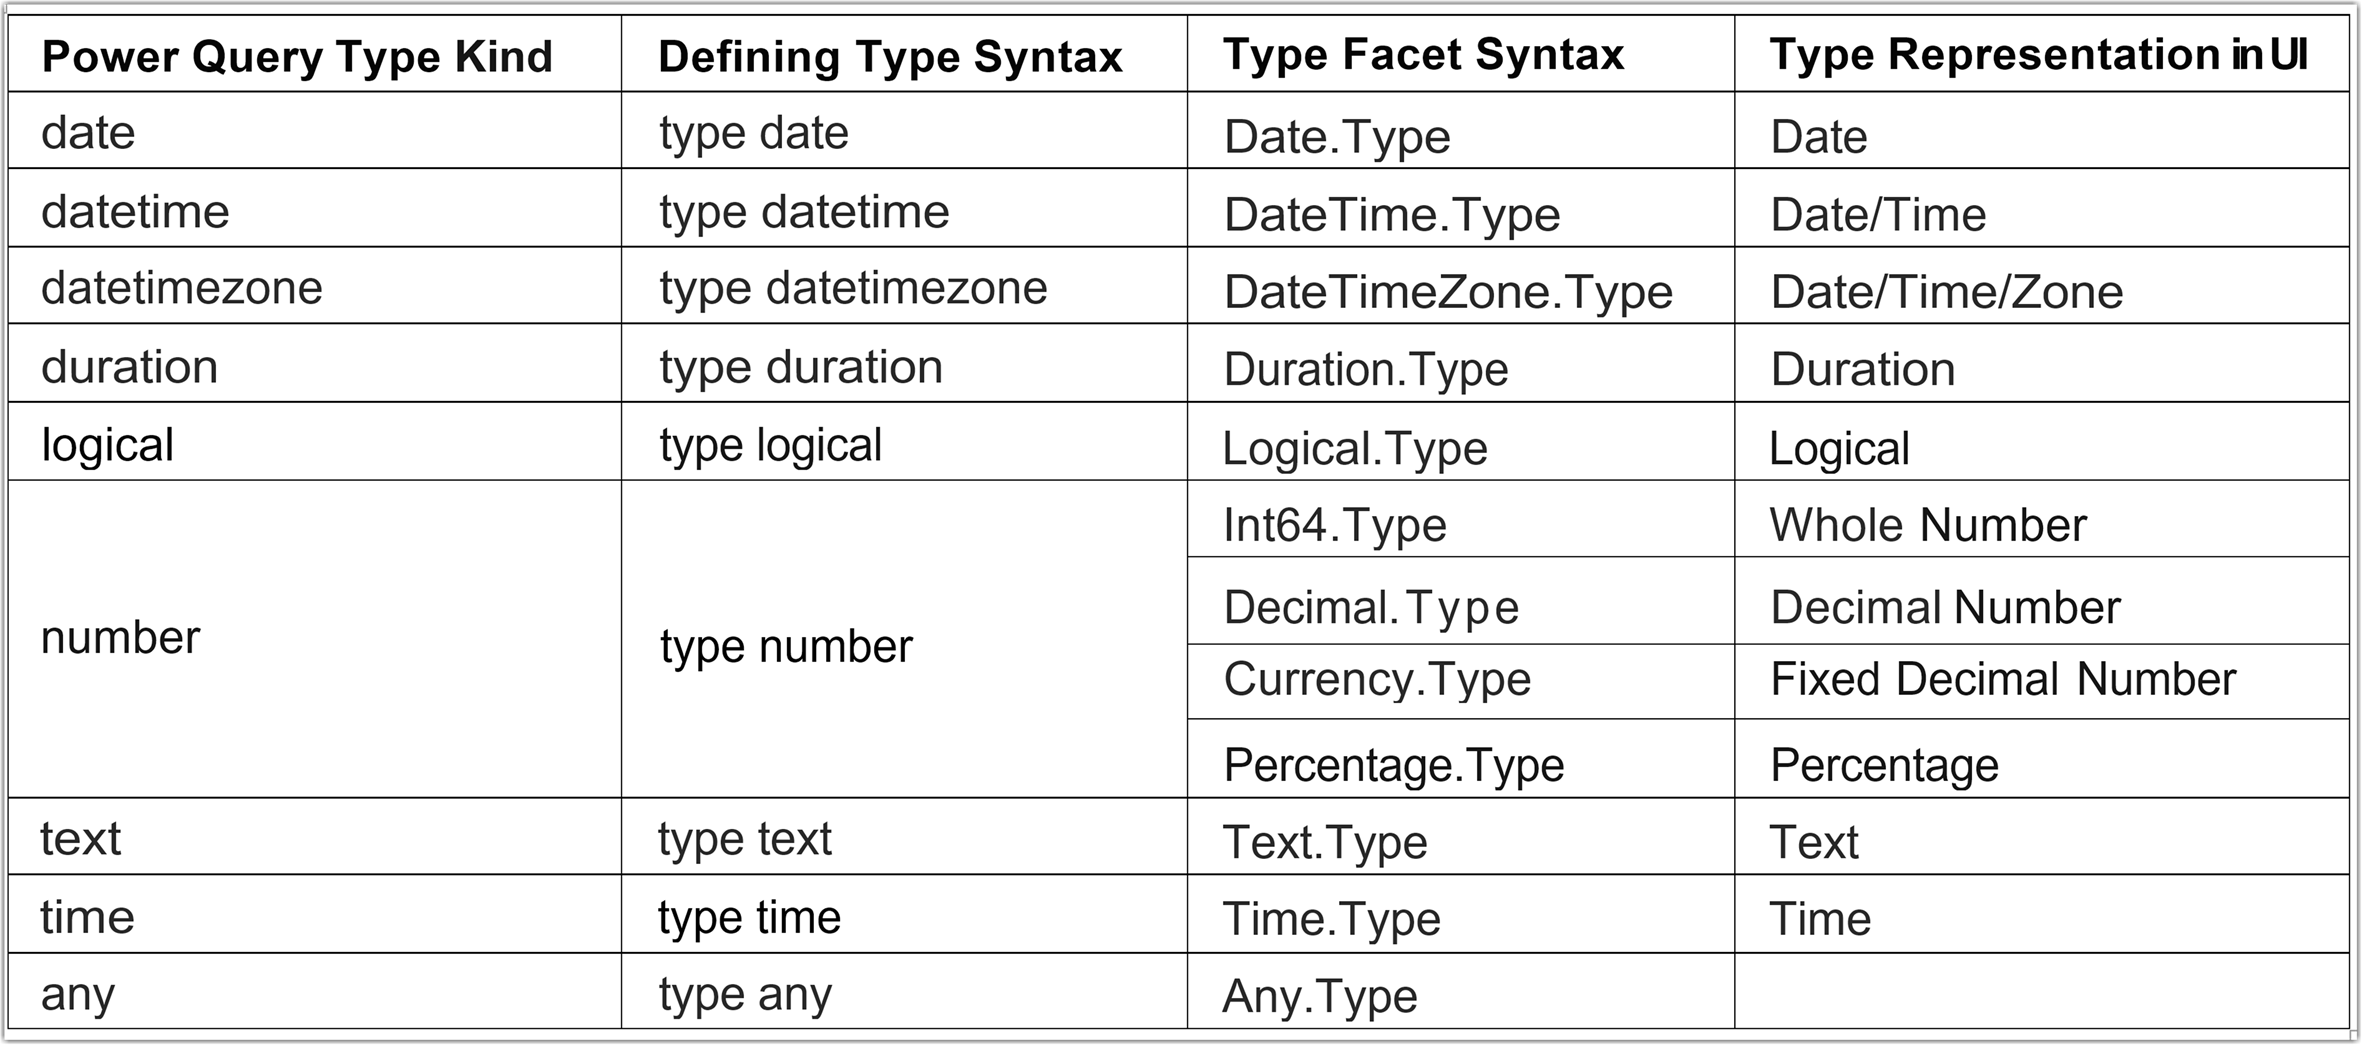
As the results show, all numeric values are of type number and the way they are represented in the Power Query Editor’s UI does not affect how the Power Query engine treats those types. The data type representations in the Power Query UI are somehow aligned with the type facets in Power Query. A facet is used to add details to a type kind. For instance, we can use facets to a text type if we want to have a text type that does not accept null. We can define the value’s types using type facets using Facet.Type syntax, such as using In64.Type for a 64-bit integer number or using Percentage.Type to show a number in percentage. However, to define the value’s type, we use the type typename syntax such as defining number using type number or a text using type text. The following table shows the Power Query types and the syntax to use to define them:
Unfortunately, the Power Query Language Specification documentation does not include facets and there are not many online resources or books that I can reference here other than Ben Gribaudo’s blog who thoroughly explained facets in detail which I strongly recommend reading.
While Power Query engine treats the values based on their types not their facets, using facets is recommended as they affect the data when it is being loaded into the data model which raises a question: what happens after we load the data into the data model? which brings us to the next section of this blog post.
Data types in Power BI data model #
Power BI uses the xVelocity in-memory data processing engine to process the data. The xVelocity engine uses columnstore indexing technology that compresses the data based on the cardinality of the column, which brings us to a critical point: although the Power Query engine treats all the numeric values as the type number, they get compressed differently depending on their column cardinality after loading the values in the Power BI model. Therefore, setting the correct type facet for each column is important.
The numeric values are one of the most common datatypes used in Power BI. Here is another example showing the differences between the four number facets. Run the following expression in a new blank query in the Power Query Editor:
// Decimal Numbers with 6 Decimal Digits
let
Source = List.Generate(()=> 0.000001, each _ <= 10, each _ + 0.000001 ),
#"Converted to Table" = Table.FromList(Source, Splitter.SplitByNothing(), null, null, ExtraValues.Error),
#"Renamed Columns" = Table.RenameColumns(#"Converted to Table",{{"Column1", "Source"}}),
#"Duplicated Source Column as Decimal" = Table.DuplicateColumn(#"Renamed Columns", "Source", "Decimal", Decimal.Type),
#"Duplicated Source Column as Fixed Decimal" = Table.DuplicateColumn(#"Duplicated Source Column as Decimal", "Source", "Fixed Decimal", Currency.Type),
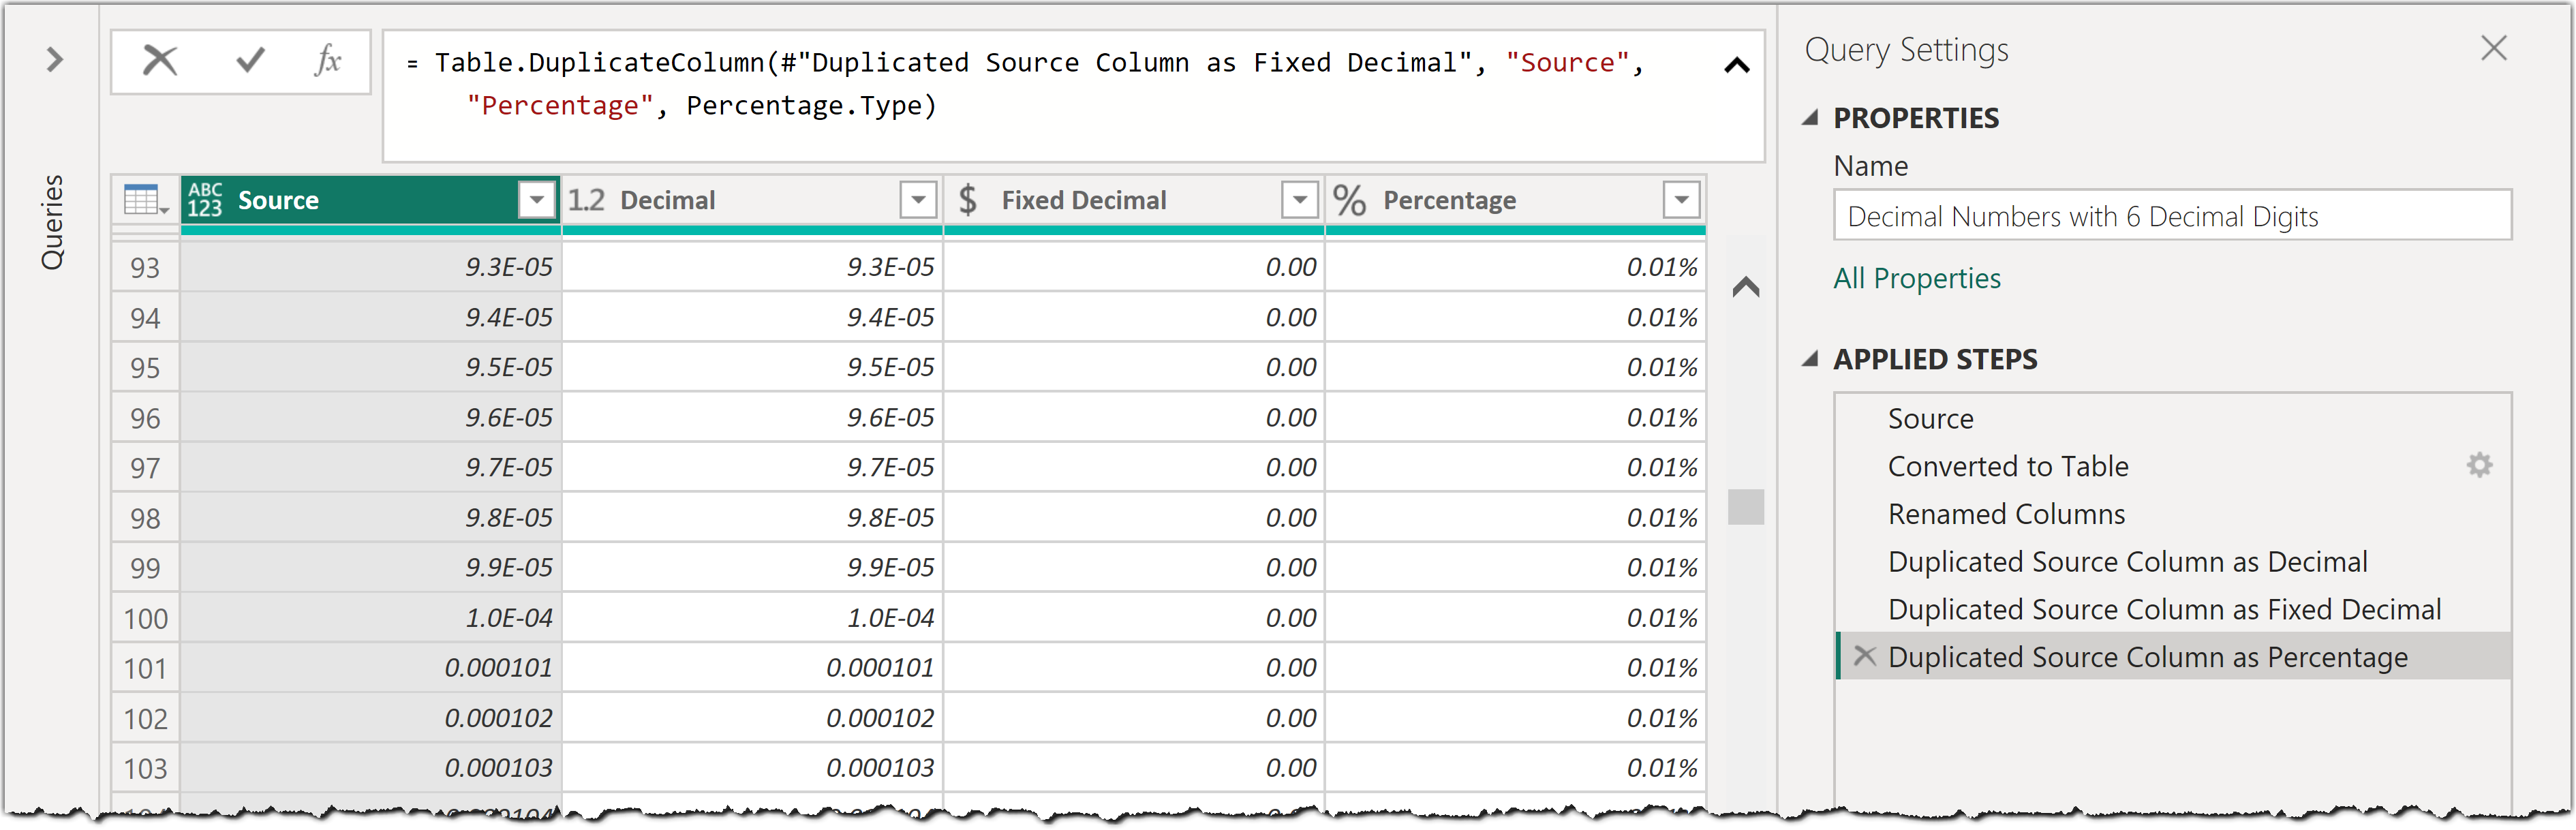
#"Duplicated Source Column as Percentage" = Table.DuplicateColumn(#"Duplicated Source Column as Fixed Decimal", "Source", "Percentage", Percentage.Type)
in
#"Duplicated Source Column as Percentage"The above expressions create 10 million rows of decimal values between 0 and 10. The resulting table has four columns containing the same data with different facets. The first column, Source, contains the values of type any, which translates to type text. The remaining three columns are duplicated from the Source column with different type facets, as follows:
- Decimal
- Fixed decimal
- Percentage
The following screenshot shows the resulting sample data of our expression in the Power Query Editor:
Now click Close & Apply from the Home tab of the Power Query Editor to import the data into the data model. At this point, we need to use a third-party community tool, DAX Studio, which can be downloaded from here.
After downloading and installing, DAX Studio registers itself as an External Tool in the Power BI Desktop as the following image shows:
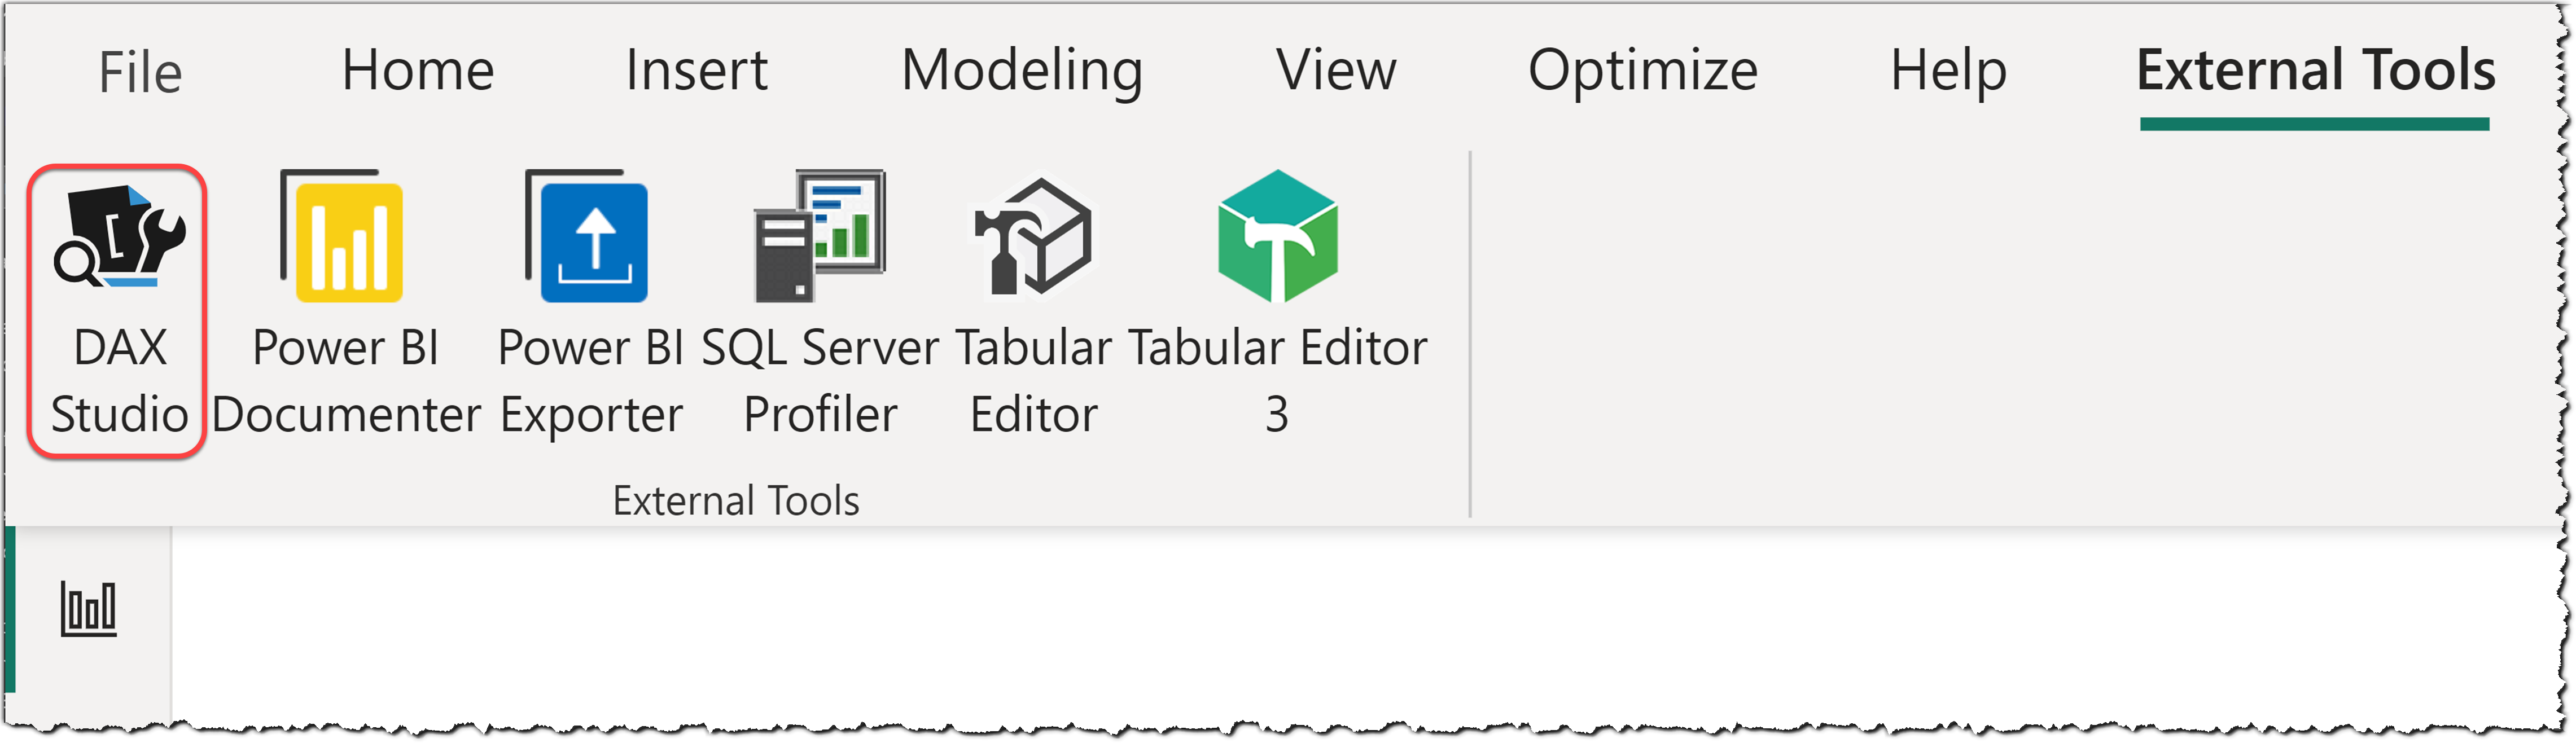
Click the DAX Studio from the External Tools tab which automatically connects it to the current Power BI Desktop model, and follow these steps:
- Click the Advanced tab
- Click the View Metrics button
- Click Columns from the VertiPaq Analyzer section
- Look at the Cardinality, Col Size, and % Table columns
The following image shows the preceding steps:
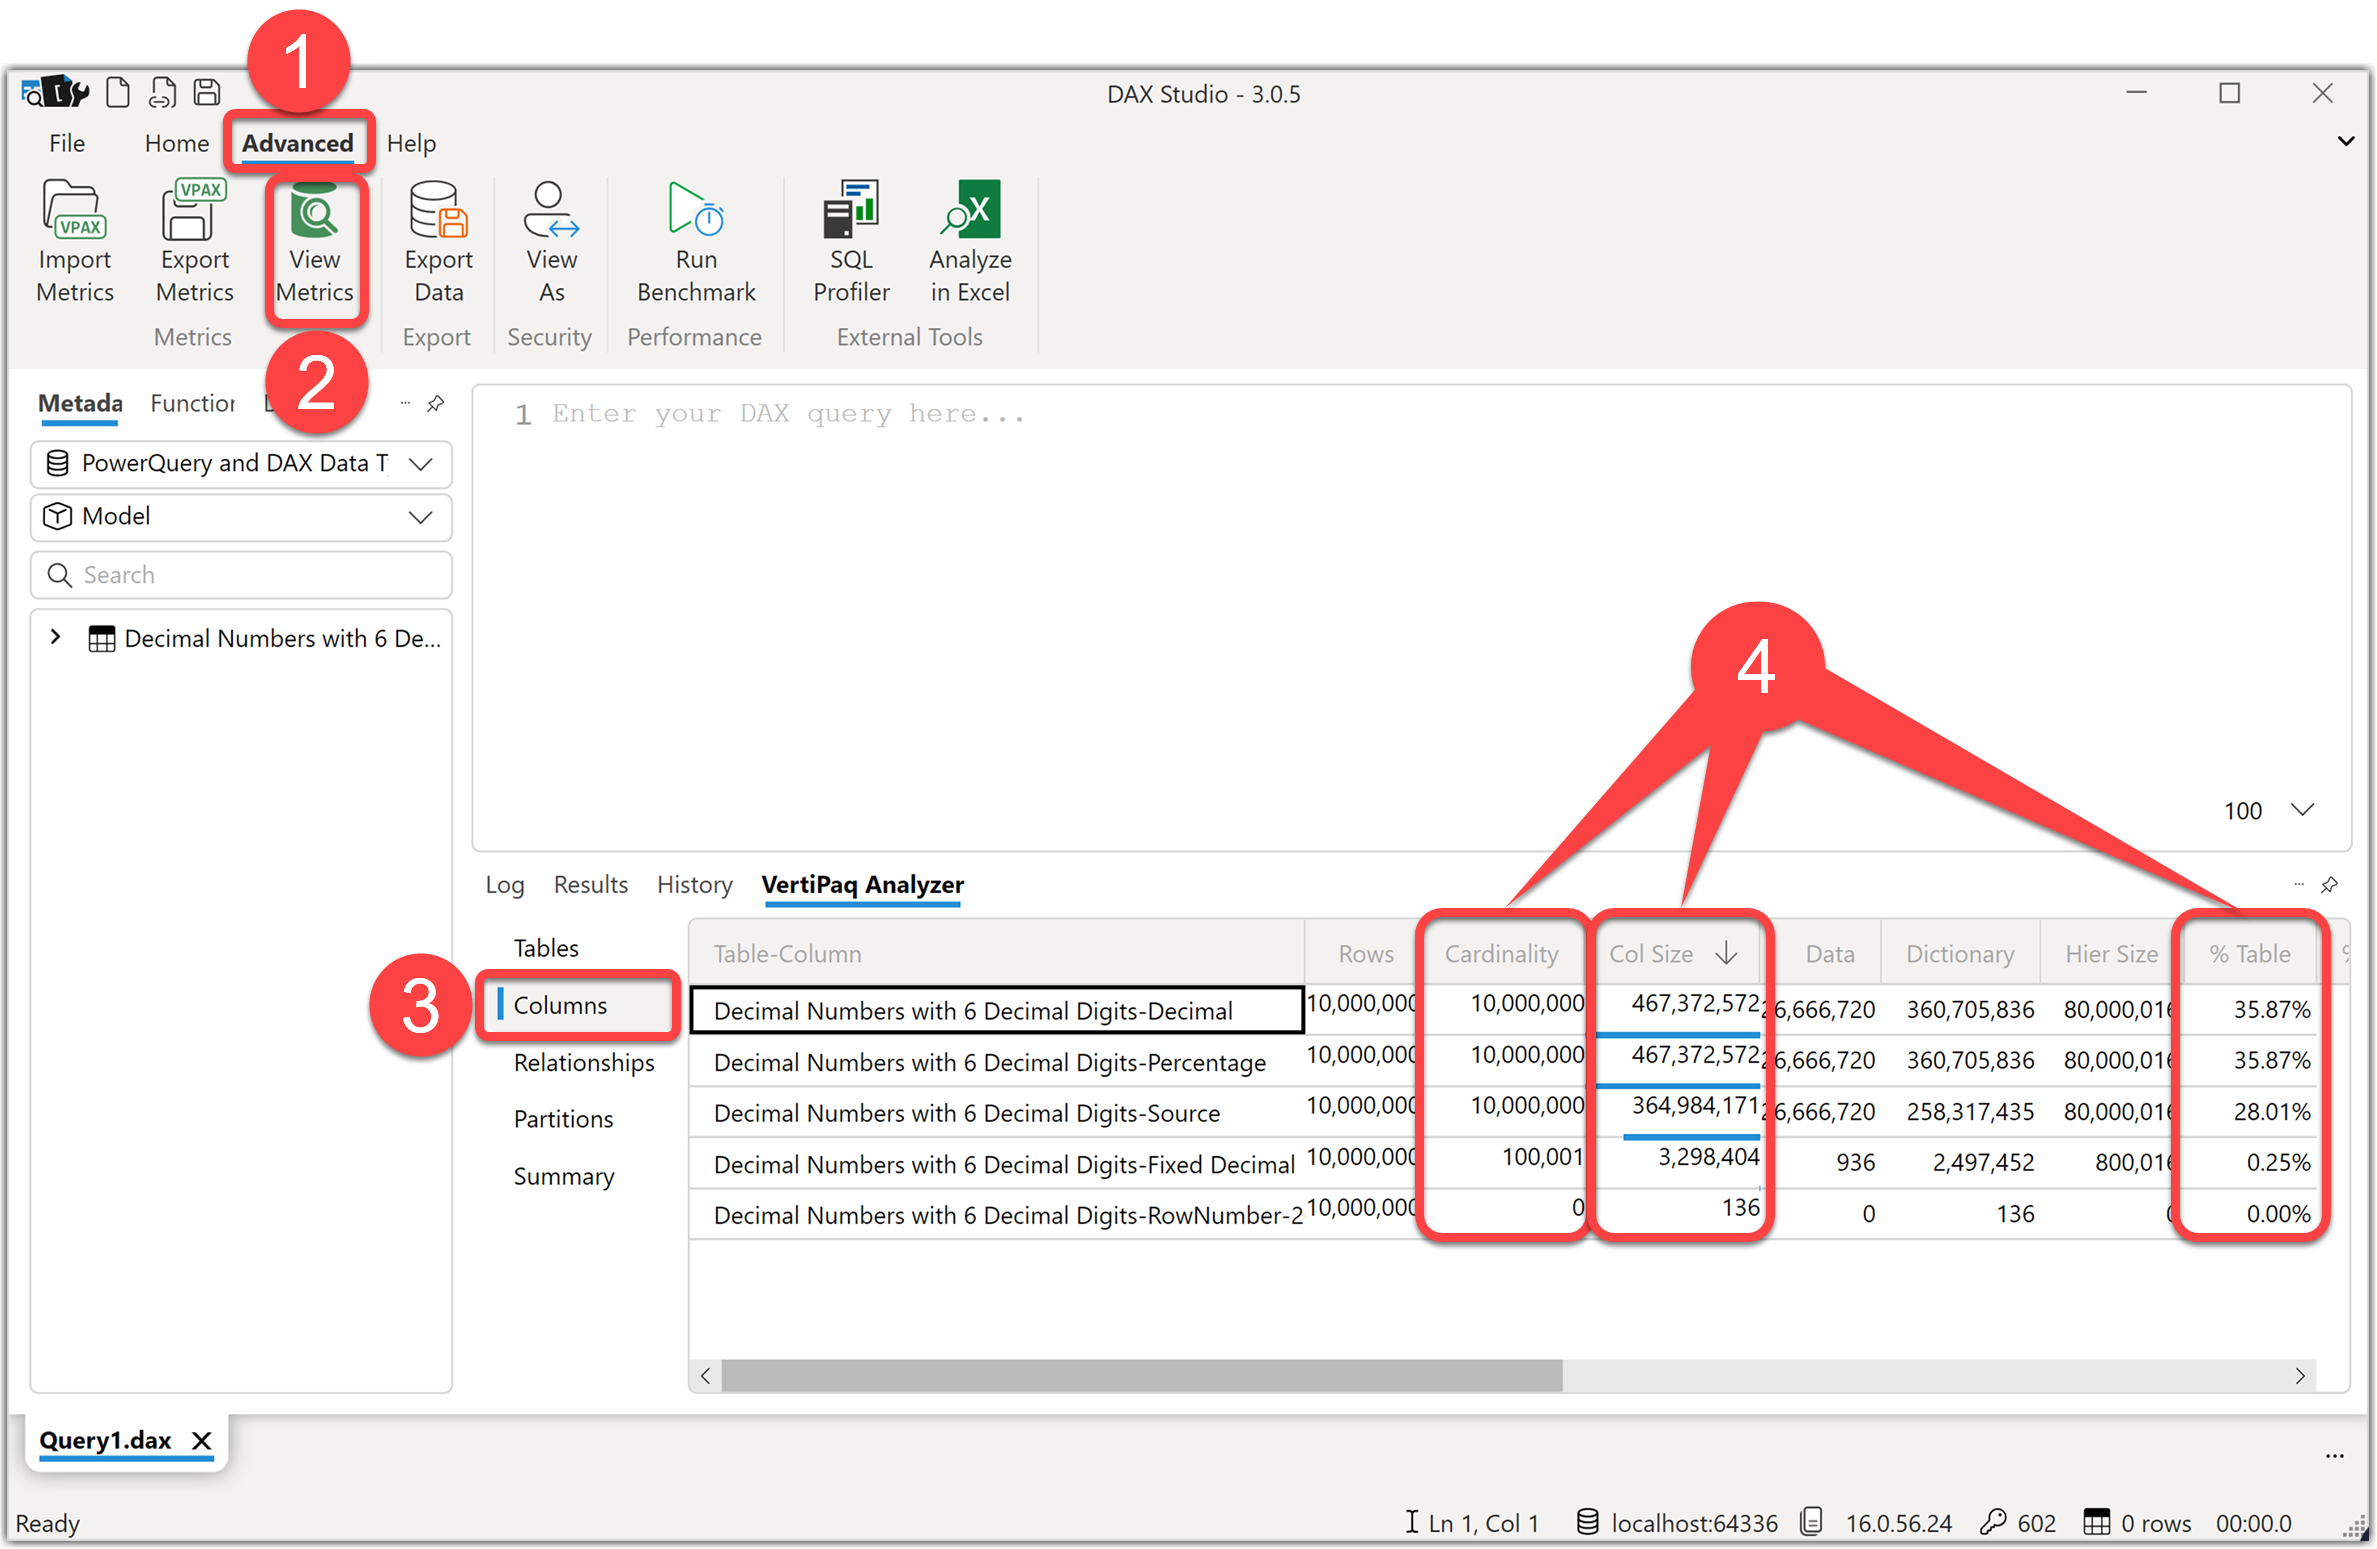
The results show that the Decimal column and Percentage consumed the most significant part of the table’s volume. Their cardinality is also much higher than the Fixed Decimal column. So here it is now more obvious that using the Fixed Decimal datatype (facet) for numeric values can help with data compression, reducing the data model size and increasing the performance. Therefore, it is wise to always use Fixed Decimal for decimal values. As the Fixed Decimal values translate to the Currency datatype in DAX, we must change the columns’ format if Currency is unsuitable. As the name suggests, Fixed Decimal has fixed four decimal points. Therefore, if the original value has more decimal digits after conversion to the Fixed Decimal, the digits after the fourth decimal point will be truncated.
That is why the Cardinality column in the VertiPaq Analyzer in DAX Studio shows much lower cardinality for the Fixed Decimal column (the column values only keep up to four decimal points, not more).
Download the sample file from here.
So, the message is here to always use the datatype that makes sense to the business and is efficient in the data model. Using the VertiPaq Analyzer in DAX Studio is good for understanding the various aspects of the data model, including the column datatypes. As a data modeler, it is essential to understand how the Power Query types and facets translate to DAX datatypes. As we saw in this blog post, data type conversion can affect the data model’s compression rate and performance.
Discover more from BI Insight
Subscribe to get the latest posts sent to your email.
Hi, may I ask a question not directly related to this blog that is tabular data model kind of a relational data model? When I introduce Power BI to people, which type of data model shall I say that is in Power BI?
PS This blog is really helpful for the people who don’t know how the xVelocity engine works in Power BI.
Hi Hung.
Power BI uses Tabular models that is a relational data model.
I hope it helps.
Cheers
Thanks Soheil Bakhshi!